
Introduction
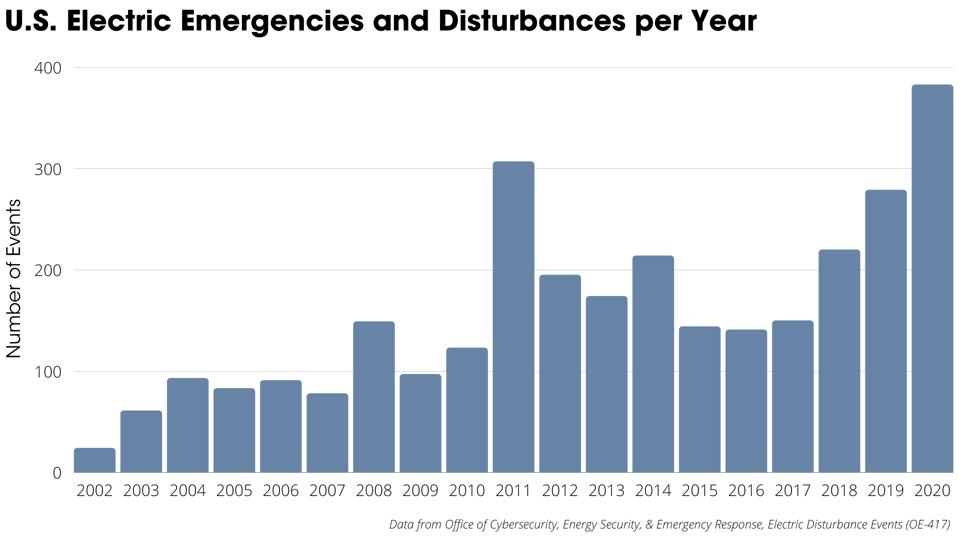
Across the United States, power disturbances have been increasing in frequency over the last few years.
Microgrids can provide resilience to power outages. A microgrid is a network of distributed energy resources and loads that can disconnect and re-connect to the larger utility grid as a single entity, allowing the connected loads to continue to be served during utility outages. While a microgrid should be able to be used year-round while connected to the grid, it can be disconnected from the grid during a power outage to provide power to critical energy needs. Microgrids use distributed energy resources like solar, wind, battery storage, gas or diesel generators, or combined heat and power. The Department of Energy has recorded 575 microgrids in the United States, about 30% of which are in Texas.
The Microgrid Resilience Framework
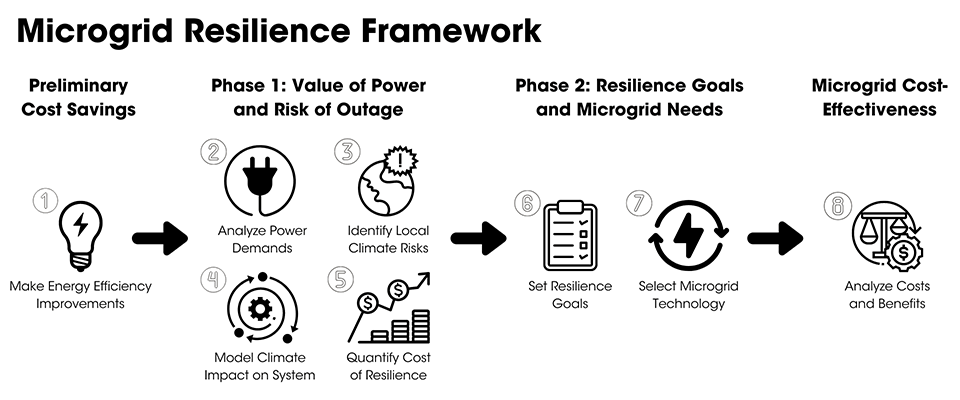
This guide provides a framework for evaluating whether your site could benefit from a microgrid. Each step of the framework includes background for why the step is important. Some steps include resources or data to help you complete them. Following is a step-by-step guide to determine the opportunity for a resilient microgrid at your site.
Step 1: Efficiency
Prior to considering microgrid, evaluate your energy use and potential to save energy and costs with energy efficiency. Reducing energy demands helps to right-size a microgrid system and reduce its costs. Microgrids for inefficient systems cost more for installation and operations. Saving energy can also save operating costs year-round. Energy audits also provide valuable info for microgrid planning.
What should you do?
- Conduct energy efficiency audit (ASHRAE Level 1 or 2 should be sufficient to begin)
- Implement a strategic energy management plan
Resources:
- EPA Energy Star
- Industrial Energy Audit Guidebook: Guidelines for Conducting an Energy Audit in Industrial Facilities
- Industrial Energy Efficiency Assessments
- A Guide to Energy Audits
- ASHRAE Procedures for Commercial Building Energy Audits
- ASHRAE Standard for Commercial Building Energy Audits
- ISO 50001 Energy Management
- PACE Energy Savings & Financing Tool
Step 2: Analyze Power Demands
Use the energy audit information from step 1 to analyze year-round power demands, including the most frequent power demand scenarios and the energy consumption of specific processes or collections of processes (sub-systems) to identify critical loads. Sub-systems will be determined in the energy audit and might be different buildings or departments within the whole system. The graphics show examples of analyzing power demands for most likely energy use cases.
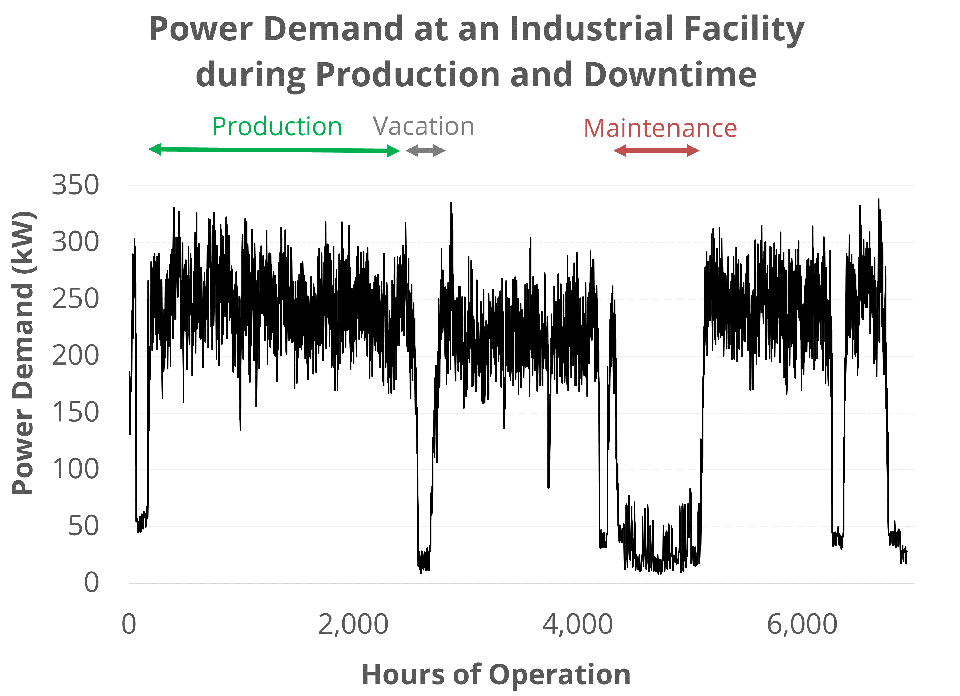
Looking at “Production Demand at an Industrial Facility during Production and Downtime,” load during production hours oscillates between 150 and 350 kilowatts (kW). Standby loads are under 50 kW for this process and maintenance loads oscillate between 20 and 80 kW.
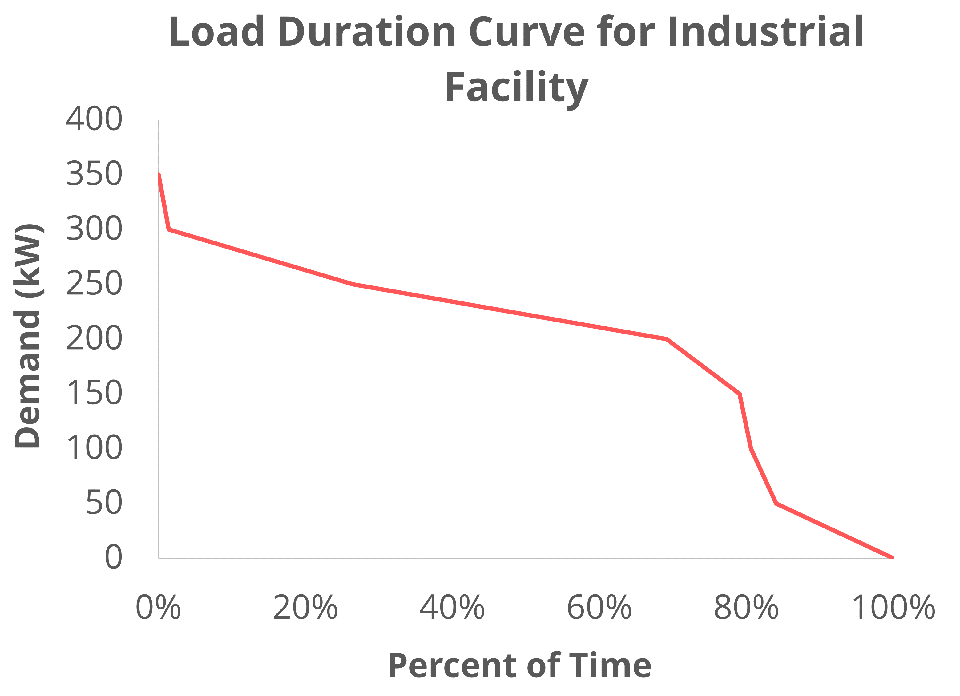
However, while the plant’s load reaches 200 kW for 69% of the year as shown in “Load Duration Curve for Industrial Facility,” it only reaches 250 kW for 26% of the year and 300 kW for 2% of the year, or 200 hours total. Under those operating conditions, the highest efficiency of the microgrid should be in the range of 50 to 200 kW.
A microgrid should be designed for continuous use, operating in cost-effective manner year-round to justify the investment. That includes being able to power the most frequent power demand scenarios, approximately 70-85% of the load duration curve in the above example or where the slope of the load duration curve plateaus.
Identifying critical loads helps to understand what power demand the microgrid needs to serve during a power outage.
Step 3: Identify Local Climate Risks
Because power outages are often associated with extreme weather or climate risks, it is important to understand those site-specific climate risks and the historic length of power outages associated with previous events. For new facilities, evaluating the experience of nearby facilities can help here.
What should you do?
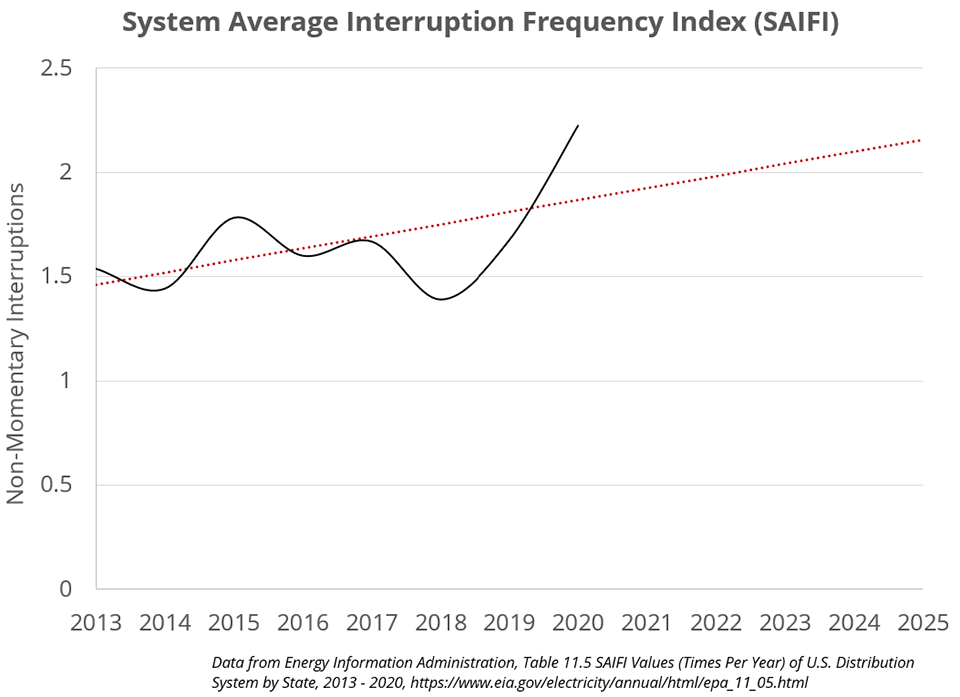
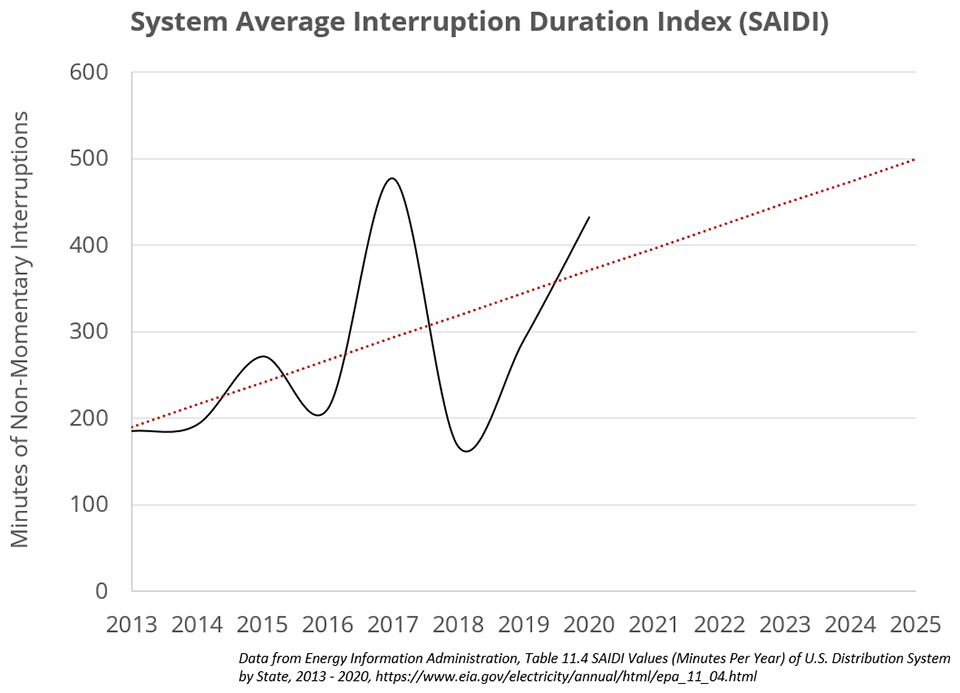
Use indicators to provide insight on historic frequency and disruptive potential of weather-related power blackouts on the manufacturing process. Power companies publish interruption data, such as System Average Interruption Frequency Index (SAIFI) and the System Average Interruption Duration Index (SAIDI). SAIFI is the average number of interruptions that a customer would experience. The SAIFI figure below shows interruptions per year in Texas alongside an increasing trendline of events. SAIDI is the average outage duration for each customer served. The SAIDI figure below shows minutes of interruptions per year through 2020 in Texas alongside an increasing trendline of minutes.
Use downscaled climate models to determine future likelihood of certain disasters to occur in the future, compared to past frequency and impact. Global Climate Models provide a set of future climate scenarios, including RCP4.5 (greenhouse gas reductions) and RCP8.5 (no greenhouse gas reductions). Climate data can be downscaled to 1/16th degree (~7km) spatial resolution and daily temporal resolution from the current year up to the year 2100 to assist with local analysis.
Resources:
- Download Local Indicators for Texas
- Download our downscaled climate data for industrial and commercial operations centers throughout Texas to determine your future climate risks.
- Plot your local indicators to determine what type of climate risks apply to your facility now and in the future. An example of county-level data is included in the figure below.
- Viewing indicators over time shows the frequency, duration, and intensity of events like heatwave, drought, and extreme precipitation. Indicators including heating and cooling degree days, longest heatwave, days above 100F, wettest 3 days, precipitation above 4 inches.
- Regional Science Information Network
- View climate indicators and explanations for Counties in the Upper Texas Gulf Coast
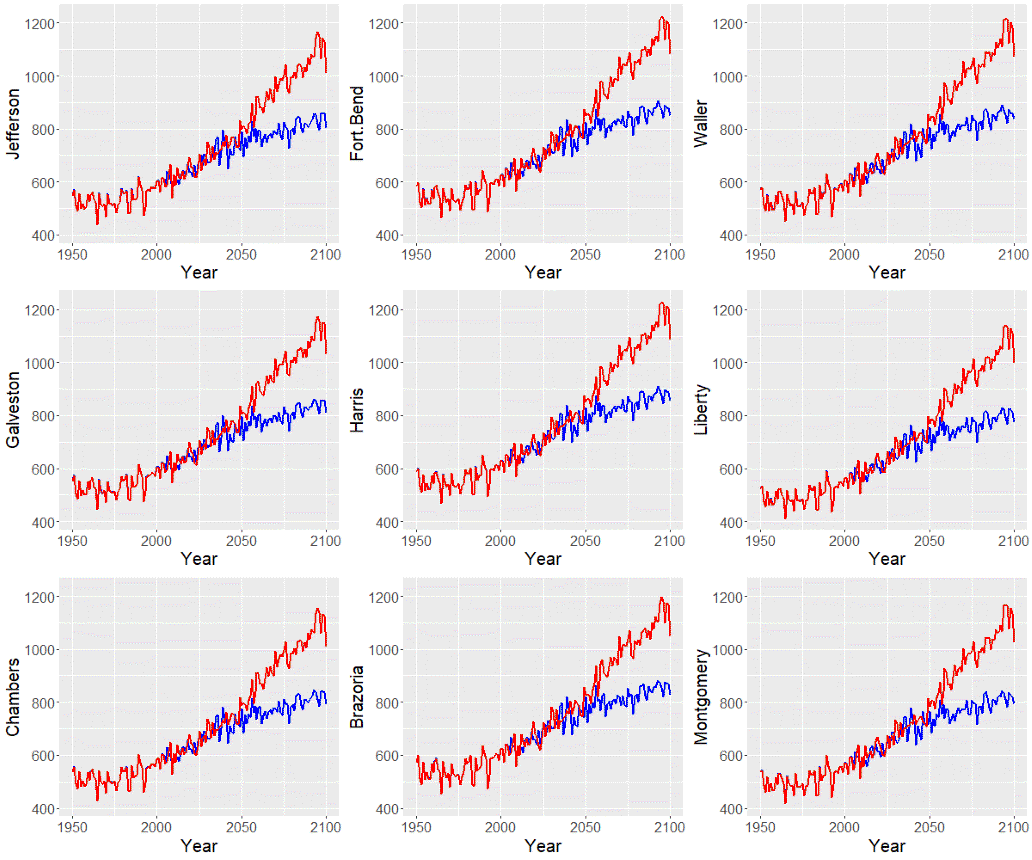
This figure shows an example of the indicator for cooling degree days in Spring from 1950 to 2100 in a nine-county area in the Houston-Galveston region of Texas.
An increase in cooling degree days means the power demand for cooling will increase, potentially increasing energy demand at your site, as well as across the power grid as residential and commercial users increase their cooling demand. Cooling and heating are the largest energy uses on the power grid and contribute to peak grid use, leading to stress on the power grid on high cooling and heating days.
Step 4: Model Climate Impact on System
Model impacts on your system, focusing on how the climate impacts would affect the most critical aspects of the industrial process, such as higher temperatures which may impact demand and grid reliability. Higher temperatures may increase your power demand. An increase in demand might require different, larger sized microgrid configurations than the historic power demand. Further, higher temperatures may impact the larger grid, resulting in a higher frequency and length of potential power blackouts. The type of industry and the initial energy audit will define which energy usages require additional modeling to be integrated with the downscaled climate models.
How could changing climate impact the size and configuration of your system?
- Extreme precipitation could lead to flooding that might damage different assets at the plant like the onsite power generating equipment or substations
- An increase in the number of days for which temperature falls below 65ºF (heating degree days) leads to an increase in energy demand for space or process heating; a similar increase in the number of days on which temperature reaches above 65ºF (cooling degree days) leads to an increase in energy demand for space or process cooling
- Factors like temperature and humidity also have an impact on the energy performance of other industrial services such as compressed air or vacuum, and on industrial thermal processes, generally
Step 5: Quantify Cost of Resilience
Determine how much resilience matters to you. How frequently do you have power outages and how important or valuable is the load you want to power? Some of the most common factors that influence the resilience needs are:
- The type of severe weather. Different severe weather events might affect the industrial processes in the short term such as hurricanes, tornadoes, or floods, or even in the mid-term like droughts or high temperatures. The former will require emergency planning while the latter will require mid-term planning to continue operating in the most cost-effective and safest manner possible.
- The nature of the services or products provided. For example, a kitchen furniture factory might decide to close the facilities when there is a flood risk to keep their employees and facilities safe while critical facilities like water treatment plants apply shelter-in-place protocols to continue operating.
- The nature of the industrial process. Some industrial processes like those employed at frozen food factories can resist brief power outages with minimal losses due to the thermal inertia of their facilities (they are typically well insulated). However, steel foundries or wastewater treatment plants, on the other hand, see their production chains impacted at the onset of a power outage.
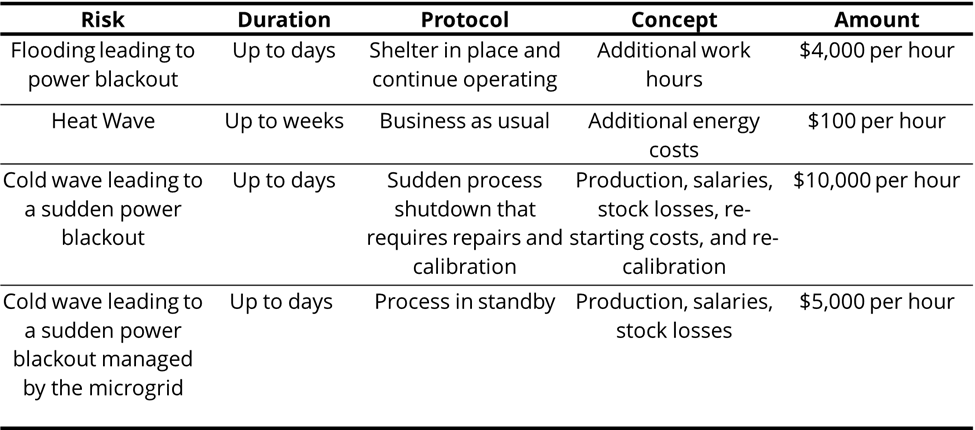
The table shows example values of resilience for industrial operators.
What should you do?
Calculating value of lost load (VOLL) can help you value the cost of resilience. There are multiple ways to calculate your VOLL, including site-specific or general estimates. Adjust your expectations if needed.
- To assess site specific VOLL, you can use the energy audit to identify specific loads and attribute the specific costs associated with specific power consumption. Assign costs to various power consumption scenarios or develop emergency and contingency plans, matching critical loads to the plans and assigning value to these loads. Use this information to determine willingness-to-pay to avoid an outage of various lengths associated with the SAIDI and SAIFI indices. Determine average costs incurred per hour for loss of planned power consumption due to each of the local climate risks scenarios based on duration estimated via the downscaled climate model.
- To determine a general estimate, you can use the Interruption Cost Estimate Calculator developed by Lawrence Berkeley National Laboratory and Nexant, Inc.
Resources:
Step 6: Set Resilience Goals
Set resilience goals using emergency and contingency plans and energy audit information. For example:
- Use of onsite generation to back up the entire process to continue operating in the short or long term
- Use of contingency power to aid in the transition to stand-by or secure mode, followed by halting the process until the conditions are met to restore operations
Resources:
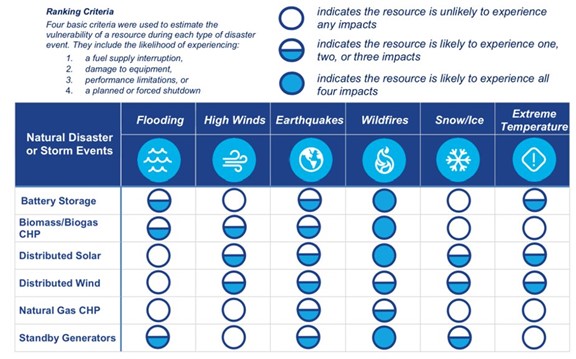
Step 7: Select Microgrid Technology
Choose microgrid technology for your site that is ideal for your local climate risks. The figure shows risks for certain technologies. For example, CHP is good for processes that demand both thermal energy and power at the same time but not if the thermal demand in the process is low. If you only require power and wants to have net zero emissions, they will need to rely on solar power and battery storage.
What should you do?
Use modeling software to determine optimum size and schedule for operating your microgrid using the resilience goals. Some considerations include:
- Potential combinations of the minimum and maximum power generation limits per generator when the microgrid is isolated from the main grid or there is a power blackout,
- Ramp-up capabilities and down and up times per technology when the microgrid is isolated from the main grid or there is power blackout,
- Efficiency of the installed battery and thermal energy storage, as they are great for providing resilience but might be in use if the microgrid is properly sized for the load of the industrial site, and
- Number of annual starts and stops required at the facility, as the more renewable energy participates of the microgrid, the more those starts and stops are required for the dispatchable energy generation resources, such as reciprocating engines or natural gas turbines, shortening their lifespan and increasing the maintenance frequencies and costs.
Resources:
Step 8: Analyze Costs and Benefits
Compare cost of resilience determined in step 5 to the cost of your choice of microgrid determined in step 7. Will your system meet your resilience needs and save you money?
Sign Up
Please sign up if you want HARC Technical Assistance to improve your site’s power resilience.